Dynamic Support and Resistance with Trend LinesDynamic Support and Resistance with Trend Lines (DSRTL)
1. Introduction & Methodology
The DSRTL indicator is designed to provide a multidimensional analysis of market structure. Unlike traditional tools that rely solely on price pivots, this script combines Static Volume-based Zones with Dynamic Trend Lines to evaluate the price's position relative to critical market components.
The S/R Identification Technique
Instead of standard pivot points, DSRTL utilizes Volume Analysis to highlight areas of significant trader participation:
- Strategy A:
Matrix Climax: Identifies candles within the lookback period that are near price extremes (Highs/Lows) and coincide with significant buying or selling volume.
- Strategy B:
Volume Extremes: Detects candles with the absolute highest buy/sell volumes within the selected lookback window, creating extreme volume-based S/R zones.
- Result:
This creates Support/Resistance (S/R) zones that are validated by actual market activity, not just price geometry.
Dynamic Trend Lines
To complement the static zones, the indicator employs two adaptive channel methods:
- Pivot Span: Connects recent significant pivots for a fast, reactive trend corridor.
- 5-Point Channel: Segments the lookback period into 5 parts to perform a linear regression analysis, creating a stable and statistically significant channel.
2. Volume Calculation Methodology
Accurate S/R detection requires distinguishing Buy Volume from Sell Volume. DSRTL offers two calculation modes:
- Geometry (Source File): Estimates buy/sell volume based on the Close price's position relative to the High/Low of the candle.
Note: This is an approximation that works on all plan types as it does not require intrabar data.
- Intrabar (Precise): Analyzes historical lower-timeframe data (e.g., 15S) to calculate intrabar-based volume deltas with higher precision compared to the geometric method.
Note: This offers superior accuracy. It requires access to historical intrabar data (depending on your plan limits). For the best analytical results, use this mode if available.
3. The Smart Matrix Engine (3D Analysis)
The core of DSRTL is its dashboard, powered by the "Smart Matrix Engine." This engine evaluates the current price in a multi-layer market structure context (Static Volume Zones + Dynamic Channels + Volume Metrics).:
A. S-State (Static): Where is the price relative to the Volume S/R zones?
B. D-State (Dynamic): Where is the price relative to the Trend Channels?
How to read the Matrix Map:
The dashboard displays a 5x5 grid representing 25 possible market scenarios.
- Rows (S1-S5): Represent the Static State (S1=Breakout, S3=Mid-Range, S5=Breakdown).
- Columns (D1-D5): Represent the Dynamic State (D1=Overextended Up, D3=Neutral, D5=Overextended Down).
- Active Cell: Marked with a dot, indicating the specific intersection of price action and market structure.
4. Matrix Interpretations (The 25 Scenarios)
Below is the detailed logic for every possible state displayed on the dashboard, explaining the Title, Bias, and actionable Signal.
Section I: S1 - Static Breakout (Price > Static Resistance)
The price has cleared the static volume resistance zone.
- S1 / D1: HYPER EXTENSION
Bias: Extreme Bullish
Signal: Caution: Exhaustion Risk. Trail stops tight.
- S1 / D2: RESISTANCE CLASH
Bias: Bullish
Signal: Breakout confirmed but facing immediate dynamic resistance.
- S1 / D3: CHANNEL BREAKOUT
Bias: Strong Bullish
Signal: Ideal Trend Continuation. Look to buy dips.
- S1 / D4: SMART PULLBACK
Bias: Bullish (Pullback)
Signal: A pullback occurring after a breakout. Strong buy opportunity.
- S1 / D5: CONFLICT (DIV)
Bias: Conflict/Reversal
Signal: Major Divergence. Static breakout is failing against dynamic structure. High Risk.
Section II: S2 - Inside Static Resistance
The price is currently testing the overhead resistance zone.
- S2 / D1: WEAK SPIKE
Bias: Neutral/Bullish
Signal: Testing resistance, but short-term overextended.
- S2 / D2: IRON FORTRESS (R)
Bias: Rejection Risk
Signal: Double Resistance (Static + Dynamic). High probability of rejection.
- S2 / D3: TESTING RES
Bias: Neutral
Signal: Consolidating at resistance. Wait for a clear break or rejection.
- S2 / D4: COMPRESSION (UP)
Bias: Conflict (Squeeze)
Signal: Squeezed between Static Resistance and Dynamic Support. Volatility imminent.
- S2 / D5: RES vs DOWN-TREND
Bias: Bearish
Signal: Strong downtrend meeting static resistance. Potential Short entry.
Section III: S3 - Mid-Range
The price is floating between significant Static Support and Resistance.
- S3 / D1: OVERBOUGHT RANGE
Bias: Rejection Risk (OB)
Signal: Overextended within the range. Potential fade (short).
- S3 / D2: RANGE HIGH LIMIT
Bias: Neutral/Bearish
Signal: At the top of the dynamic channel. Look for rejection signs.
- S3 / D3: NEUTRAL / CHOPPY
Bias: Neutral
Signal: Dead Center. Low probability environment. Avoid trading.
- S3 / D4: RANGE DIP BUY
Bias: Neutral/Bullish
Signal: At the bottom of the dynamic channel. Look for bounce signs.
- S3 / D5: WEAK RANGE (OS)
Bias: Bounce Risk (OS)
Signal: Oversold within the range. Potential fade (long).
Section IV: S4 - Inside Static Support
The price is currently testing the floor support zone.
- S4 / D1: SUP vs UP-TREND
Bias: Bullish
Signal: Strong uptrend meeting static support. Potential Long entry.
- S4 / D2: COMPRESSION (DN)
Bias: Conflict (Squeeze)
Signal: Squeezed between Static Support and Dynamic Resistance. Volatility imminent.
- S4 / D3: TESTING SUPPORT
Bias: Neutral
Signal: Consolidating at support. Wait for a bounce or breakdown.
- S4 / D4: IRON FLOOR (S)
Bias: Bounce Risk
Signal: Double Support (Static + Dynamic). High probability of a bounce.
- S4 / D5: WEAK DIP
Bias: Neutral/Bearish
Signal: Testing support, but short-term oversold.
Section V: S5 - Static Breakdown (Price < Static Support)
The price has dropped below the static volume support zone.
- S5 / D1: CONFLICT (DIV)
Bias: Conflict/Reversal
Signal: Major Divergence. Static breakdown is failing. High Risk.
- S5 / D2: BEAR PULLBACK
Bias: Bearish (Pullback)
Signal: A pullback occurring after a breakdown. Strong selling opportunity.
- S5 / D3: CHANNEL BREAKDOWN
Bias: Strong Bearish
Signal: Ideal Trend Continuation (Down). Sell rallies.
- S5 / D4: SUPPORT CLASH
Bias: Bearish
Signal: Breakdown confirmed but facing immediate dynamic support.
- S5 / D5: HYPER DROP (VOID)
Bias: Extreme Bearish
Signal: Caution: Climax risk. Trail stops for shorts.
DISCLAIMER & EDUCATIONAL PURPOSE
This indicator is strictly an educational tool designed to visualize complex market structure concepts. Its primary purpose is to help traders "bridge the gap" between academic theory and real-time market behavior by providing a visual representation of support, resistance, and volume dynamics.
Please Note:
1. Not a Trading Strategy: This script is an analytical assistant, not a standalone "Black Box" trading system. It does not generate buy or sell signals that should be followed blindly.
2. No Financial Advice: The data provided by this tool is for informational purposes only. It is not a recommendation to buy or sell any asset.
3. Risk Warning: Trading involves significant risk. Always use your own judgment, perform your own technical analysis, and use proper risk management. Do not use this tool as the sole basis for your trading decisions.
4. Data Precision & Platform Limits: The "Intrabar (Precise)" calculation mode relies on high-resolution historical data to provide exact results. Access to this specific data depth depends entirely on your platform's subscription capabilities. If your plan does not support this level of historical intrabar data, the Precise mode may have limited coverage. In that case, you should switch to "Geometry" mode for a fully populated view.
스크립트에서 "VOLUME DELTA"에 대해 찾기

OI Bahavior MapThis indicator visualizes Open Interest (OI) changes for Binance Futures and highlights the behavior of market participants — whether takers or makers are opening or closing positions.
📊 Supported display modes:
• Taker or Maker
• Longs or Shorts
• Cumulative or Per-Bar
• Displayed in USD or Coins
💡 Each candle color reflects the dominant trade direction (delta):
🟢 Green = Aggressive buying (Delta Buy)
🔴 Red = Aggressive selling (Delta Sell)
OI direction (↑/↓) determines whether positions are being opened or closed.
🛠️ Optional metrics:
• Moving average of OI (SMA, EMA, WMA, VWMA, LSMA)
• Volatility channels (Bollinger Bands or Extremums)
⚙️ How it works:
• Fetches OI data from the SYMBOL_OI ticker (e.g., BTCUSDT_OI)
• Compares current OI with the previous bar
• Uses signed volume delta (close - open) to infer intent
• Classifies bar as open/close, long/short, taker/maker
• Displays the net effect as a colored candle on a secondary chart
🤔 How to interpret Taker and Maker?
• Taker: The aggressive participant who removes liquidity (initiates the trade)
• Maker: The passive participant who provides liquidity (places resting orders)
You can choose to display the same event from either the Taker or Maker perspective — the chart will look the same, but the interpretation changes.
🧠 Core Logic Mapping
```
🟢 Green: Taker Longs (Buy, OI↑) | Maker Shorts (Buy, OI↓)
🔴 Red: Taker Shorts (Sell, OI↑) | Maker Longs (Sell, OI↓)
```
⚠️ Limitations:
• Works only for Binance Futures
• Requires existence of SYMBOL_OI ticker on TradingView
• Represents approximate intent based on OI + volume behavior
💬 Open Source
The script is open for the community. Suggestions and feedback are welcome in the comments!
__________________________________________________________________________________
Этот индикатор визуализирует изменения открытого интереса (OI) для Binance Futures и показывает поведение участников рынка — открывают или закрывают позиции тейкеры или мейкеры.
📊 Доступные режимы отображения:
• Taker или Maker
• Longs или Shorts
• Кумулятивный или по бару
• В USD или в монетах
💡 Каждый цвет свечи отражает преобладающее направление сделок (дельта):
🟢 Зеленый = Агрессивные покупки (Delta Buy)
🔴 Красный = Агрессивные продажи (Delta Sell)
Направление OI (↑/↓) показывает, открываются или закрываются позиции.
🛠️ Дополнительные метрики:
• Скользящая средняя OI (SMA, EMA, WMA, VWMA, LSMA)
• Волатильностные каналы (Bollinger Bands или экстремумы)
⚙️ Как работает:
• Получает данные OI из тикера SYMBOL_OI (например, BTCUSDT_OI)
• Сравнивает текущий OI с предыдущим баром
• Использует направленную дельту объема (close - open) для определения намерения
• Классифицирует бар как открытие/закрытие, лонг/шорт, тейкер/мейкер
• Отображает итог в виде цветной свечи на дополнительном графике
🤔 Как интерпретировать Taker и Maker?
• Taker: Агрессивный участник, который изымает ликвидность (инициирует сделку)
• Maker: Пассивный участник, который создает ликвидность (выставляет лимитные заявки)
Вы можете выбрать отображение события с позиции тейкера или мейкера — график будет одинаковым, но смысл меняется.
🧠 Схема логики
```
🟢 Зеленый: Taker Longs (Покупка, OI↑) | Maker Shorts (Покупка, OI↓)
🔴 Красный: Taker Shorts (Продажа, OI↑) | Maker Longs (Продажа, OI↓)
```
⚠️ Ограничения:
• Работает только для Binance Futures
• Требуется наличие тикера SYMBOL_OI на TradingView
• Показывает приблизительное намерение на основе OI и дельты объема
💬 Open Source
Скрипт открыт для сообщества. Предложения и обратная связь приветствуются в комментариях!

CVD Divergence Strategy.1.mmThis is the matching Strategy version of Indicator of the same name.
As a member of the K1m6a Lions discussion community we often use versions of the Cumulative Volume Delta indicator
as one of our primary tools along with RSI, RSI Divergences, Open interest, Volume Profile, TPO and Fibonacci levels.
We also discuss visual interpretations of CVD Divergences across multiple time frames much like RSI divergences.
RSI Divergences can be identified as possible Bullish reversal areas when the RSI is making higher low points while
the price is making lower low points.
RSI Divergences can be identified as possible Bearish reversal areas when the RSI is making lower high points while
the price is making higher high points.
CVD Divergences can also be identified the same way on any timeframe as possible reversal signals. As with RSI, these Divergences
often occur as a trend's momentum is giving way to lower volume and areas when profits are being taken signaling a possible reversal
of the current trending price movement.
Hidden Divergences are identified as calculations that may be signaling a continuation of the current trend.
Having not found any public domain versions of a CVD Divergence indicator I have combined some public code to create this
indicator and matching strategy. The calculations for the Cumulative Volume Delta keep a running total for the differences between
the positive changes in volume in relation to the negative changes in volume. A relative upward spike in CVD is created when
there is a large increase in buying vs a low amount of selling. A relative downward spike in CVD is created when
there is a large increase in selling vs a low amount of buying.
In the settings menu, the is a drop down to be used to view the results in alternate timeframes while the chart remains on current timeframe. The Lookback settings can be adjusted so that the divs show on a more local, spontaneous level if set at 1,1,60,1. For a deeper, wider view of the divs, they can be set higher like 7,7,60,7. Adjust them all to suit your view of the divs.
To create this indicator/strategy I used a portion of the code from "Cumulative Volume Delta" by @ contrerae which calculates
the CVD from aggregate volume of many top exchanges and plots the continuous changes on a non-overlay indicator.
For the identification and plotting of the Divergences, I used similar code from the Tradingview Technical "RSI Divergence Indicator"
This indicator should not be used as a stand-alone but as an additional tool to help identify Bullish and Bearish Divergences and
also Bullish and Bearish Hidden Divergences which, as opposed to regular divergences, may indicate a continuation.

CVD Divergence Indicator.1.mmAs a member of the K1m6a Lions discussion community we often use versions of the Cumulative Volume Delta indicator
as one of our primary tools along with RSI, RSI Divergences, Open interest, Volume Profile, TPO and Fibonacci levels.
We also discuss visual interpretations of CVD Divergences across multiple time frames much like RSI divergences.
RSI Divergences can be identified as possible Bullish reversal areas when the RSI is making higher low points while
the price is making lower low points.
RSI Divergences can be identified as possible Bearish reversal areas when the RSI is making lower high points while
the price is making higher high points.
CVD Divergences can also be identified the same way on any timeframe as possible reversal signals. As with RSI, these Divergences
often occur as a trend's momentum is giving way to lower volume and areas when profits are being taken signaling a possible reversal
of the current trending price movement.
Hidden Divergences are identified as calculations that may be signaling a continuation of the current trend.
Having not found any public domain versions of a CVD Divergence indicator I have combined some public code to create this
indicator and matching strategy. The calculations for the Cumulative Volume Delta keep a running total for the differences between
the positive changes in volume in relation to the negative changes in volume. A relative upward spike in CVD is created when
there is a large increase in buying vs a low amount of selling. A relative downward spike in CVD is created when
there is a large increase in selling vs a low amount of buying.
In the settings menu, the is a drop down to be used to view the results in alternate timeframes while the chart remains on current timeframe. The Lookback settings can be adjusted so that the divs show on a more local, spontaneous level if set at 1,1,60,1. For a deeper, wider view of the divs, they can be set higher like 7,7,60,7. Adjust them all to suit your view of the divs.
To create this indicator/strategy I used a portion of the code from "Cumulative Volume Delta" by @ contrerae which calculates
the CVD from aggregate volume of many top exchanges and plots the continuous changes on a non-overlay indicator.
For the identification and plotting of the Divergences, I used similar code from the Tradingview Technical "RSI Divergence Indicator"
This indicator should not be used as a stand-alone but as an additional tool to help identify Bullish and Bearish Divergences and
also Bullish and Bearish Hidden Divergences which, as opposed to regular divergences, may indicate a continuation.

Vollinger BandsI'm happy to present to you... VOLLINGER BANDS. Loosely based on bollinger bands, this indicator uses the new Up/Down Volume indicator from tradingview, which I have add moving averages, and a width calculation between them to determine squeeze. Essentially I have created a volume squeeze bollinger band derivative, hence the term "Vollinger Band".
The bands are NOT a deviation of any middle line or moving average, but rather their own moving averages of the volume delta, respectively.
Blue background = Volume Squeeze (vollinger bands width is less than the squeeze strength line), meaning consolidation, and a big move may happen soon.
Top line = A moving average of the Up Volume delta
Bottom line = A moving average of the Down Volume delta
Vol MA = the moving average length of both the top/bottom line
> If you zoom in, you can see a white line, which is the squeeze represented as a single line, calculated using bollinger bands width. The squeeze strength is a moving average of the squeeze line, which then determines if the width is below that moving average, then the squeeze will occur (white line below purple)
The bands are colored based on the sum of the Up/Down volume over the specified number of bars (preset at 5). If the volume is more buying than selling over that amount of bars, then the line is colored green, and vice versa.

CVD Ichimoku(s)ENGLISH
What is this indicator?
This is a combination of two indicators: the CVD - Cumulative Volume Delta Candles published by TradingView (version v3 2022.07.11) with two Ichimoku clouds: one for the current time frame and another for a bigger time frame.
The user of the indicator can define that bigger time frame with a multiplier. By default it multiplies x6 the current TF (for example, if you watch at the 1 hour time frame the second kumo belongs to 6 hour TF).
Additionaly, an orange line replicates the senko span A without displacement. It is extra layer of visual information that can be hidded from settings.
How it should be used?
Delta Volume indicators can be hard to read. This format gives the trader an overview of where the agressive buyers/sellers are in relation to past market orders. And relative to price if used in combination with the classic Ichimoku indicator on price. I recommend to use it as a support for your ideas applying Ichimoku's calculations deep knowledge.
CATALÀ*
Què és aquest indicador?
És una combinació de dos indicadors: el CVD - Cumulative Volume Delta Candles publicat per TradingView (versió v3 2022.07.11) amb dos Ichimoku clouds: on pel time frame actual i un altre per un time frame superior.
L'usuari de l'indicador pot definir aquest time frame superior mitjançant un multiplicador. Per defecte multiplica x6 el TF actual (per exemple, si uses l'indicador al time frame d'1 hora, el segon kumo correspondrà al TF de 6 hores).
Adicionalment hi ha una línia taronja que replica el senko span A sense desplaçament. És una capa extra d'informació visual que pot ser amagada des de la configuració.
Com s'ha de fer servir?
Els indicadors de Delta Volume poden ser difícils de llegir. Aquest format dona al tradejador una visió global d'on són els compradors/venedors agressius en relació al mercat d'ordres passat. I relatiu al preu en combinació amb el clàssic indicdor Ichimoku sobre preu. Recomano usar-lo com a suport per les teves idees aplicant un profund coneixement dels càlculs d'Ichimoku.
*Catalan is a language speaked since 8th century in most eastern territories of the current Spain (Catalunya, Illes Balears, País Valencià), south of France and some zones of Italy. Catalan is spoken by some 9,000,000 people in Spain and some 125,000 in France, as well as by some 30,000 in Andorra and some 40,000 in Alghero.

Smart Money Flow PRO + MFI [PERCENT]Smart Money Flow PRO + MFI Indicator
Professional Smart Money Tracking with Multi-Timeframe Analysis
This advanced indicator combines volume analysis, money flow, and smart money detection to identify high-probability trade setups. Perfect for traders who want to follow institutional money flow.
🎯 KEY FEATURES:
📊 SMART MONEY DETECTION:
Volume Delta analysis (bullish/bearish volume tracking)
Cumulative Delta with trend detection
Smart Money Power formula combining multiple factors
Open Interest simulation for market depth
📈 MULTI-CONFIRMATION SYSTEM:
Money Flow Index (MFI) with custom overbought/oversold zones
Bullish/Bearish Divergence detection
Convergence signals for trend confirmation
Real-time market state analysis
🎨 PROFESSIONAL VISUALS:
Percentage-based table showing all metrics in 0-100% scale
Color-coded strength indicators (Strong/Medium/Weak)
Oscillator window with MFI, Delta, and Power histograms
Clean, organized layout with intuitive icons
⚡ TRADING SIGNALS:
STRONG BUY/SELL alerts with multiple confirmations
Divergence/convergence visual markers on chart
Real-time entry signals with strength classification
Customizable alert conditions
🔄 FLEXIBLE SETTINGS:
Adjustable MFI parameters
Custom volume thresholds
Divergence sensitivity controls
Complete color customization
Perfect for: Day traders, swing traders, and anyone wanting to track institutional money flow with professional-grade analytics.
All calculations in percentages for instant readability and decision-making.

Dynamic ~ CVDDynamic - CVD is a smart, time-adaptive version of the classic Cumulative Volume Delta (CVD) indicator, designed to help traders visualize market buying and selling pressure across all timeframes with minimal manual tweaking.
Overview
Cumulative Volume Delta tracks the difference between buying and selling volume during each bar. It reveals whether aggressive buyers or sellers dominate the market, offering deep insight into real-time market sentiment and underlying momentum.
This version of CVD automatically adjusts its EMA smoothing length based on your selected timeframe, ensuring optimal sensitivity and consistency across intraday, daily, weekly, and even monthly charts.
Features
Dynamic EMA Length — Automatically adapts smoothing parameters based on the chart timeframe:
1–59 min → 50
1–23 h → 21
Daily & Weekly → 100
Monthly → 10
CVD Visualization — Displays cumulative delta to show the ongoing buying/selling imbalance.
CVD‑EMA Curve — Offers a clear trend signal by comparing the CVD line with its EMA.
Adaptive Color Logic — EMA curve changes color dynamically:
Green when CVD > EMA (bullish pressure)
Gray when CVD < EMA (bearish pressure)
How to Use
Use Dynamic - CVD to gauge whether the market is accumulating (net buying) or distributing (net selling).
When CVD rises above its EMA, it often signals consistent buying pressure and potential bullish continuation.
When CVD stays below its EMA, it highlights sustained selling pressure and possible weakness.
The dynamic EMA makes it suitable for scalping, swing trading, and longer-term trend analysis—no need to manually adjust settings.
Best For
Traders looking to measure real buying/selling flow rather than price movement alone.
Market participants who want a plug‑and‑play CVD that stays accurate across all timeframes.
Anyone interested in volume‑based momentum confirmation tools.
Disclaimer
This script is provided for educational and analytical purposes only. It does not constitute financial advice or a recommendation to buy or sell any asset. Past performance is not indicative of future results. Always perform your own analysis and consult a licensed financial advisor before making investment decisions. The author is not responsible for any financial losses or trading outcomes arising from the use of this indicator.

Trapped Traders [ScorsoneEnterprises]This indicator identifies and visualizes trapped traders - market participants caught on the wrong side of price movements with significant volume imbalances. By analyzing volume delta at specific price levels, it reveals where traders are likely experiencing unrealized losses and may be forced to exit their positions.
The point of this tool is to identify where the liquidity in a trend may be.
var lowerTimeframe = switch
useCustomTimeframeInput => lowerTimeframeInput
timeframe.isseconds => "1S"
timeframe.isintraday => "1"
timeframe.isdaily => "5"
=> "60"
= ta.requestVolumeDelta(lowerTimeframe)
price_quantity = map.new()
is_red_candle = close < open
is_green_candle = close > open
for i=0 to lkb-1 by 1
current_vol = price_quantity.get(close)
new_vol = na(current_vol) ? lastVolume : current_vol + lastVolume
price_quantity.put(close, new_vol)
if is_green_candle and new_vol < 0
price_quantity.put(close, new_vol)
else if is_red_candle and new_vol > 0
price_quantity.put(close, new_vol)
We see in this snippet, the lastVolume variable is the most recent volume delta we can receive from the lower timeframe, we keep updating the price level we're keeping track of with that lastVolume from the lower timeframe.
This is the bulk of the concept as this level and size gives us the idea of how many traders were on the wrong side of the trend, and acting as liquidity for the profitable entries. The more, the stronger.
There are 3 ways to visualize this. A basic label, that will display the size and if positive or negative next to the bar, a gradient line that goes 10 bars to the future to be used as a support or resistance line that includes the quantity, and a bubble chart with the quantity. The larger the quantity, the bigger the bubble.
We see in this example on NYMEX:CL1! that there are lines plotted throughout this price action that price interacts with in meaningful way. There are consistently many levels for us.
Here on CME_MINI:ES1! we see the labels on the chart, and the size set to large. It is the same concept just another way to view it.
This chart of CME_MINI:RTY1! shows the bubble chart visualization. It is a way to view it that is pretty non invasive on the chart.
Every timeframe is supported including daily, weekly, and monthly.
The included settings are the display style, like mentioned above. If the user would like to see the volume numbers on the chart. The text size along with the transparency percentage. Following that is the settings for which lower timeframe to calculate the volume delta on. Finally, if you would like to see your inputs in the status line.
No indicator is 100% accurate, use "Trapped Traders" along with your own discretion.

Z-Score Volume with CVD ConfirmationZ-Score Volume with CVD Confirmation is a volume-based confluence tool that enhances traditional volume analysis by combining Z-Score volume anomalies with Cumulative Volume Delta (CVD) confirmation. This indicator helps traders identify unusual volume activity that aligns with directional order flow, offering a cleaner signal for potential breakout or reversal scenarios.
🔍 Key Features:
Z-Score Calculation: Measures how extreme current volume is relative to its recent average, highlighting statistically significant surges or drops.
CVD Confirmation: Uses Cumulative Volume Delta candles (open/high/low/close) to assess buying vs. selling pressure in lower timeframes.
Bar Color Logic:
Green: High Z-Score volume confirmed by CVD bullish candle
Red: High Z-Score volume confirmed by CVD bearish candle
Other color bands show progressively strong or weak volume outliers
Real Volume Bar Heights: Volume bars retain true scale while color reflects underlying order flow strength and direction.
💡 Use Cases:
Breakout validation: Confirm price range breaks when volume surge is supported by CVD direction
Fade setups: Detect unsustainable high-volume moves lacking CVD support
Trend continuation: Spot momentum when both Z-Score and CVD align in the direction of the trend
⚙️ How to Use:
Adjust the Z-Score length to define how far back to measure average and deviation.
Select your anchor timeframe (typically 1D) and a lower timeframe for CVD calculations (e.g., 1-minute).
Use color-coded volume bars to assess volume significance and directional flow at a glance.
Add the standard volume indicator to the chart so one can compare the difference between the standard volume indicator and the Z-Score Volume with CVD Confirmation script. Useful at specific price levels and exiting ranges or not.

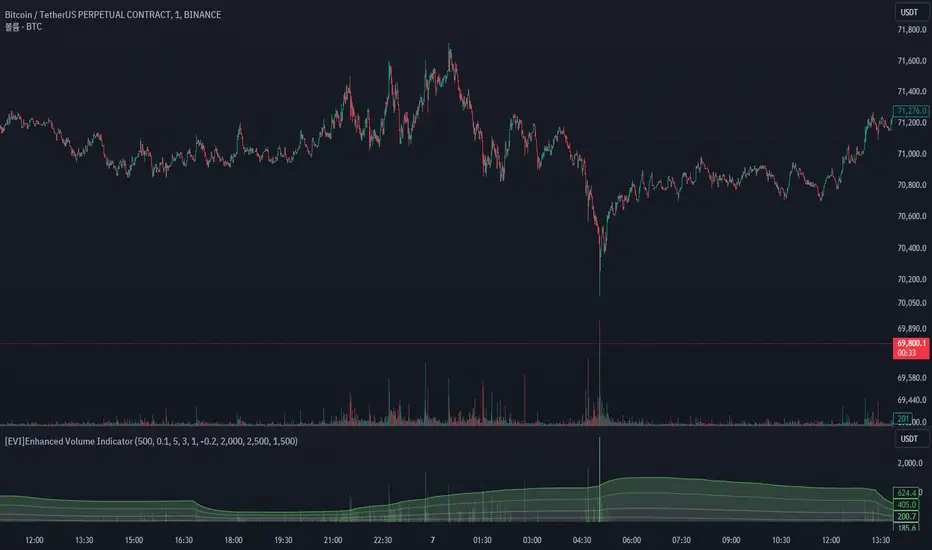
[EVI]Enhanced Volume IndicatorEnglish Version
Enhanced Volume Indicator (EVI)
The Enhanced Volume Indicator (EVI) is an advanced yet user-friendly tool designed to measure and visualize the strength of market volume using the statistical power of standard deviation. By offering a clear and dynamic representation of volume fluctuations, the EVI enables traders to effortlessly identify significant market movements and potential trading opportunities.
Key Features:
Sophisticated Volume Strength Assessment: The EVI leverages the standard deviation of historical candle volumes to evaluate and categorize the current volume intensity. This sophisticated methodology allows for the precise detection of when current volume levels significantly deviate from their historical norms.
Intuitive Visual Cues: Volume bars are color-coded to represent varying levels of volume intensity, ranging from very weak to very strong. This intuitive visual differentiation aids traders in quickly grasping the market's underlying volume dynamics at a glance.
Proactive Threshold Alerts: Stay ahead of the market with the EVI’s built-in alert functionality. Receive real-time notifications of critical volume changes, ensuring that you remain informed of significant market developments even while away from your trading desk.
How It Works:
The EVI calculates the Simple Moving Average (SMA) and Standard Deviation (STDEV) of volume over a user-defined period (default set to 500 candles). Utilizing these statistical measures, the indicator establishes various volume thresholds by applying predefined multipliers for extreme, high, medium, and low volume levels. The volume bars are then color-coded based on these thresholds, providing traders with a clear visual representation of volume intensity. Additionally, horizontal lines indicating these thresholds are plotted on the chart for easy reference, further enhancing the indicator’s usability.
This version of the EVI is particularly suited for traders who prefer simplicity and efficiency over complexity, making it an excellent alternative to the more intricate Volume Delta Divergence (VDD) indicator. The EVI delivers powerful volume insights in a straightforward and accessible manner, ensuring that even those who favor less complexity can benefit from robust volume analysis.
Ideal for traders seeking to capture major market moves or pinpoint potential reversals, the Enhanced Volume Indicator (EVI) is a must-have tool. Elevate your trading strategy with the EVI and ensure you never miss out on significant volume breakouts again.
Korean Version
Enhanced Volume Indicator (EVI)
Enhanced Volume Indicator (EVI)는 시장 볼륨의 강도를 표준편차의 통계적 힘을 사용하여 측정하고 시각화하는 고급적이면서도 사용하기 쉬운 도구입니다. EVI는 볼륨 변동의 명확하고 동적인 표현을 제공하여 트레이더가 중요한 시장 움직임과 잠재적인 거래 기회를 쉽게 식별할 수 있도록 합니다.
주요 기능:
정교한 볼륨 강도 평가: EVI는 이전 캔들의 볼륨 표준편차를 활용하여 현재 볼륨 강도를 평가하고 분류합니다. 이 정교한 방법론은 현재 볼륨 수준이 과거 평균에서 크게 벗어날 때를 정확하게 감지할 수 있도록 합니다.
직관적인 시각적 신호: 볼륨 바는 매우 약한 것부터 매우 강한 것까지 다양한 볼륨 강도를 나타내는 색상으로 코딩됩니다. 이 직관적인 시각적 차별화는 트레이더가 시장의 기본적인 볼륨 동향을 한눈에 쉽게 파악할 수 있도록 돕습니다.
선제적 임계값 알림: EVI의 내장 알림 기능으로 시장을 앞서가십시오. 중요한 볼륨 변화에 대한 실시간 알림을 받아 거래 데스크를 떠나 있는 동안에도 중요한 시장 발전에 대해 계속 정보를 얻을 수 있습니다.
작동 원리:
EVI는 사용자가 정의한 기간(기본값은 500 캔들)의 볼륨에 대한 단순 이동평균(SMA)과 표준편차(STDEV)를 계산합니다. 이러한 통계적 측정을 활용하여, 인디케이터는 극단적, 높은, 중간 및 낮은 볼륨 수준에 대한 사전 정의된 배수를 적용하여 다양한 볼륨 임계값을 설정합니다. 그런 다음, 볼륨 바는 이러한 임계값을 기반으로 색상 코딩되어 트레이더에게 볼륨 강도의 명확한 시각적 표현을 제공합니다. 또한, 이러한 임계값을 나타내는 수평선이 차트에 참조용으로 표시되어 인디케이터의 사용성을 더욱 향상시킵니다.
이 버전의 EVI는 복잡함보다는 단순함과 효율성을 선호하는 트레이더에게 특히 적합하여, 더 복잡한 Volume Delta Divergence (VDD) 인디케이터에 대한 훌륭한 대안이 됩니다. EVI는 강력한 볼륨 정보를 간단하고 접근 가능한 방식으로 제공하여, 복잡함을 싫어하는 사용자도 강력한 볼륨 분석의 혜택을 누릴 수 있도록 합니다.
주요 시장 움직임을 포착하거나 잠재적인 반전을 식별하려는 트레이더에게 이상적인 Enhanced Volume Indicator (EVI)는 반드시 갖추어야 할 도구입니다. EVI로 트레이딩 전략을 강화하고 중요한 볼륨 돌파를 절대 놓치지 마세요.
Market Sessions and TPO (+Forecast)This indicator "Market Sessions and TPO (+Forecast)" shows various market sessions alongside a TPO profile (presented as the traditional lettering system or as bars) and price forecast for the duration of the session.
Additionally, numerous statistics for the session are shown.
Features
Session open and close times presented in boxes
Session pre market and post market shown
TPO profile generated for each session (normal market hours only)
A forecast for the remained of the session is projected forward
Forecast can be augmented by ATR
Naked POCs remain on the chart until violated
Volume delta for the session shown
OI Change for the session shown (Binance sourced)
Total volume for the session shown
Price range for the session shown
The image above shows processes of the indicator.
Volume delta, OI change, total volume and session range are calculated and presented for each session.
Additionally, a TPO profile for the most recent session is shown, and a forecast for the remainder of the active session is shown.
The image above shows an alternative display method for the session forecast and TPO profile!
Additionally, the pre-market and post-market times are denoted by dashed boxes.
The image above exemplifies additional capabilities.
That's all for now; further updates to come and thank you for checking this out!
And a special thank you to @TradingView of course, for making all of this possible!

Cumulative DeltaThis scripts calculates the cumulative volume delta within the current day.
Options allow you to change the display type of this data (3 different configurations are given in the chart above)
The following options are available:
Colors selection
Reset cumulative delta everyday (can be disable to keep a continuous calculation of the delta over days)
Show histogram (used to display the delta as a positive/negative histogram)
Show daily High/Low levels (draw highest and lowest delta levels within the day)
Show candles (display the cumulative delta as candles)
Show Moving average (display a moving average which is reseted everyday at the same time as the cumulative delta itself)
Moving average length
This script will be updated if I feel the need to improve things or to add new features
RVSILibrary "RVSI"
This Library contains functions that calculate all types of " Relative Volume Strength Index (MZ RVSI ) " depending upon unique volume oscillator. Achieved RVSI value can be used for divergence detection in volume or to adapt dynamic length in Moving Averages or other functions.
rvsi_tfs(vol_src, vol_Len, rvsiLen, _open, _close) Relative Volume Strength Index based on TFS Volume Oscillator
Parameters:
vol_src : Volume Source
vol_Len : Volume Legth for TFS Volume Oscillato
rvsiLen : Period of Relative Volume Strength Index
_open : Ticker Open Value
_close : Ticker Close Value
Returns: Relative Volume Strength Index value based on TFS Volume Oscillator
rvsi_obv(vol_src, rvsiLen, _close) Relative Volume Strength Index based on On Balance Volume
Parameters:
vol_src : Volume Source to Calculate On Balance Volume
rvsiLen : Period of Relative Volume Strength Index
_close : Ticker Close Value
Returns: Relative Volume Strength Index value based on On Balance Volume
rvsi_kvo(vol_src, FastX, SlowX, rvsiLen, _close) Relative Volume Strength Index based on Klinger Volume Oscillator
Parameters:
vol_src : Volume Source
FastX : Volume Fast Length
SlowX : Volume Slow Length
rvsiLen : Period of Relative Volume Strength Index
_close : Ticker Close Value
Returns: Relative Volume Strength Index value based on Klinger Volume Oscillator
rvsi_vzo(vol_src, zLen, rvsiLen, _close) Relative Volume Strength Index based on Volume Zone Oscillator
Parameters:
vol_src : Volume Source
zLen : Volume Legth for Volume Zone Oscillator
rvsiLen : Period of Relative Volume Strength Index
_close : Ticker Close Value
Returns: Relative Volume Strength Index value based on Volume Zone Oscillator
rvsi_cvo_obv(vol_src, ema1len, ema2len, rvsiLen) Relative Volume Strength Index based on Cumulative Volume Oscillator with On Balance Volume as Calculations Source
Parameters:
vol_src : Volume Source
ema1len : EMA Fast Length
ema2len : EMA Slow Length
rvsiLen : Period of Relative Volume Strength Index
Returns: Relative Volume Strength Index value based on Cumulative Volume Oscillator with On Balance Volume as Calculations Source
rvsi_cvo_pvt(vol_src, FastX, SlowX, rvsiLen) Relative Volume Strength Index based on Cumulative Volume Oscillator with Price Volume Trend as Calculations Source
Parameters:
vol_src : Volume Source
FastX : EMA Fast Length
SlowX : EMA Slow Length
rvsiLen : Period of Relative Volume Strength Index
Returns: Relative Volume Strength Index value based on Cumulative Volume Oscillator with Price Volume Trend as Calculations Source
rvsi_cvo_cvd(vol_src, FastX, SlowX, rvsiLen, _open, _close, _high, _low) Relative Volume Strength Index based on Cumulative Volume Oscillator with Cumulative Volume Delta as Calculations Source
Parameters:
vol_src : Volume Source
FastX : EMA Fast Length
SlowX : EMA Slow Length
rvsiLen : Period of Relative Volume Strength Index
_open : Ticker Open Value
_close : Ticker Close Value
_high : Ticker High Value
_low : Ticker Low Value
Returns: Relative Volume Strength Index value based on Cumulative Volume Oscillator with Cumulative Volume Delta as Calculations Source
Force DashboardScalping Dashboard - Complete User Guide
Overview
This scalping system consists of two complementary TradingView indicators designed for intraday trading with no overnight holds:
Force Dashboard - Single-row table showing real-time market bias and entry signals
Large Order Detection - Visual diamonds showing institutional order flow
Together, they provide a complete at-a-glance view of market conditions optimized for quick entries and exits.
Recommended Timeframes
Primary Scalping Timeframes
1-minute chart: Ultra-fast scalps (30 seconds - 3 minutes hold time)
2-minute chart: Quick scalps (2-5 minutes hold time)
5-minute chart: Standard scalps (5-15 minutes hold time)
Best Practices
Use 1-2 minute for highly liquid instruments (ES, NQ, major forex pairs)
Use 5-minute for less liquid markets or if you prefer fewer signals
Never hold past the last hour of trading to avoid overnight risk
Set hard stop times (e.g., exit all positions by 3:45 PM EST)
Dashboard Components Explained
Core Indicators (Circles ●)
MACD (5/13/5)
Green ● = Bullish momentum (MACD histogram positive)
Red ● = Bearish momentum (MACD histogram negative)
Gray ● = No clear momentum
Use: Confirms trend direction and momentum shifts
EMA (9/20/50)
Green ● = Price > EMA9 > EMA20 (uptrend)
Red ● = Price < EMA9 < EMA20 (downtrend)
Gray ● = Choppy/sideways
Use: Identifies the immediate micro-trend
Stoch (5-period Stochastic)
Green ● = Oversold (<20) - potential reversal up
Red ● = Overbought (>80) - potential reversal down
Gray ● = Neutral zone (20-80)
Use: Spots reversal opportunities at extremes
RSI (7-period)
Green ● = Oversold (<30)
Red ● = Overbought (>70)
Gray ● = Neutral
Use: Confirms overbought/oversold conditions
CVD (Cumulative Volume Delta)
Green ● = CVD above its moving average (buying pressure)
Red ● = CVD below its moving average (selling pressure)
Gray ● = Neutral
Use: Shows overall buying vs selling pressure
ΔCVD (Delta CVD - Rate of Change)
Green ● = CVD accelerating upward (buying acceleration)
Red ● = CVD accelerating downward (selling acceleration)
Gray ● = No acceleration
Use: Detects momentum shifts in order flow
Imbal (Order Flow Imbalance)
Green ● = Buy pressure >2x sell pressure
Red ● = Sell pressure >2x buy pressure
Gray ● = Balanced
Use: Identifies extreme one-sided order flow
Vol (Volume Strength)
Green ● = Volume >1.5x average (strong interest)
Red ● = Volume <0.7x average (low interest)
Gray ● = Normal volume
Yellow background = Volume surge (>2x average) - BIG MOVE ALERT
Use: Confirms conviction behind price moves
Tape (Tape Speed)
Green ● = Fast order flow (>1.3x normal)
Red ● = Slow order flow (<0.7x normal)
Gray ● = Normal speed
Yellow background = Very fast tape (>1.5x) - RAPID EXECUTION ALERT
Use: Measures urgency and speed of orders
Key Levels
Support (Supp)
Shows the nearest high-volume support level below current price
Bright Green background = Price is AT support (within 0.3%) - BOUNCE ZONE
Green background = Price above support (healthy)
Red background = Price below support (broken support, now resistance)
Resistance (Res)
Shows the nearest high-volume resistance level above current price
Bright Orange background = Price is AT resistance (within 0.3%) - REJECTION ZONE
Red background = Price below resistance (facing overhead supply)
Green background = Price above resistance (breakout)
These levels update automatically every 3 bars based on volume profile
Entry Signal Components
Score
Displays format: "6L" (6 long indicators) or "4S" (4 short indicators)
Bright Green = 6-7 indicators aligned for long
Light Green = 5 indicators aligned for long
Yellow = 4 indicators aligned (weaker setup)
Gray = No alignment
Red/Orange colors = Same scale for short setups
Score of 5+ indicates high-probability setup
SCALP (Main Entry Signal)
BRIGHT GREEN "LONG" = High-quality long scalp (Score 5+)
Green "LONG" = Decent long scalp (Score 4)
BRIGHT ORANGE "SHORT" = High-quality short scalp (Score 5+)
Red "SHORT" = Decent short scalp (Score 4)
Gray "WAIT" = No clear setup - STAY OUT
Entry Strategies
Strategy 1: High-Probability Scalps (Conservative)
When to Enter:
SCALP column shows BRIGHT GREEN "LONG" or BRIGHT ORANGE "SHORT"
Score is 5 or higher
Vol or Tape has yellow background (volume surge)
Example Long Setup:
SCALP = BRIGHT GREEN "LONG"
Score = 6L
Vol = Yellow background
Price AT Support (bright green Supp cell)
EMA, MACD, CVD, ΔCVD, Imbal all green
Entry: Enter immediately on next candle
Target: 0.5-1% move or resistance level
Stop: Below support or -0.3%
Hold Time: 2-10 minutes
Strategy 2: Momentum Scalps (Aggressive)
When to Enter:
Tape has yellow background (fast tape)
Vol has yellow background (volume surge)
ΔCVD is green (for longs) or red (for shorts)
Imbal shows strong imbalance in your direction
Score is 4+
Example Short Setup:
Tape & Vol = Yellow backgrounds
ΔCVD = Red, Imbal = Red
Price AT Resistance (bright orange)
Score = 5S
Entry: Enter immediately
Target: Quick 0.3-0.7% move
Stop: Tight -0.2%
Hold Time: 1-5 minutes
Strategy 3: Reversal Scalps (Mean Reversion)
When to Enter:
Stoch shows oversold (green) or overbought (red)
RSI confirms the extreme
Price is AT Support (for longs) or AT Resistance (for shorts)
ΔCVD and Imbal start reversing direction
Score is 4+
Example Long Setup:
Stoch = Green (oversold)
RSI = Green (oversold)
Supp = Bright green (at support)
ΔCVD turns green
Imbal turns green
Score = 4L or 5L
Entry: Wait for confirmation candle
Target: Move back to EMA9 or mid-range
Stop: Below the low
Hold Time: 3-8 minutes
Large Order Detection Usage
Diamond Signals
Green diamonds below bar = Large buy orders (institutional buying)
Red diamonds above bar = Large sell orders (institutional selling)
Size matters: Larger diamonds = larger order flow
How to Use with Dashboard
Confirmation Entries
Dashboard shows "LONG" signal
Green diamond appears
Enter immediately - institutions are buying
Divergence Alerts (CAUTION)
Dashboard shows "LONG" signal
RED diamond appears (institutions selling)
DO NOT ENTER - conflicting order flow
Cluster Patterns
Multiple green diamonds in row = Strong accumulation, stay long
Multiple red diamonds in row = Strong distribution, stay short
Alternating colors = Chop, avoid trading
Risk Management Rules
Position Sizing
Risk 0.5-1% of account per scalp
Maximum 3 concurrent positions
Reduce size after 2 consecutive losses
Stop Loss Guidelines
Tight stops: 0.2-0.3% for 1-2 min charts
Standard stops: 0.3-0.5% for 5 min charts
Always use stop loss - no exceptions
Place stops below support (longs) or above resistance (shorts)
Take Profit Targets
Target 1: 0.3-0.5% (take 50% off)
Target 2: 0.7-1% (take remaining 50%)
Move stop to breakeven after Target 1 hit
Trail stop if Score remains high
Time-Based Exits
Exit immediately if:
SCALP changes from LONG/SHORT to WAIT
Score drops below 3
Large diamond appears in opposite direction
Maximum hold time: 15 minutes (even if profitable)
Hard exit time: 30 minutes before market close
Trading Sessions
Best Times to Scalp
High-Liquidity Sessions
9:30-11:00 AM EST (Market open, highest volume)
2:00-3:30 PM EST (Afternoon session, good moves)
Avoid
11:30 AM-1:30 PM EST (Lunch, low volume)
Last 30 minutes (unpredictable, don't initiate new trades)
News releases (wait 5 minutes for volatility to settle)
Common Patterns & Setups
The Perfect Storm (Highest Probability)
Score = 6L or 7L
SCALP = BRIGHT GREEN
Vol + Tape = Yellow backgrounds
Green diamond appears
Price AT Support
Win rate: ~70-80%
The Fade Setup (Counter-Trend)
Price hits resistance (bright orange)
Stoch + RSI overbought (red)
Red diamond appears
CVD starts turning red
SCALP shows "SHORT"
Win rate: ~60-70%
The Breakout Continuation
Price breaks resistance (Res turns green)
EMA, MACD green
Vol surge (yellow)
Multiple green diamonds
SCALP = "LONG"
Win rate: ~65-75%
Warning Signs - DO NOT TRADE
Red Flags
❌ SCALP shows "WAIT"
❌ Score below 3
❌ Vol and Tape both gray (no volume)
❌ Conflicting signals (dashboard says LONG but red diamonds appearing)
❌ Alternating green/red circles (choppy market)
❌ Support and Resistance very close together (tight range)
Market Conditions to Avoid
Low volume periods
Major news releases (first 5 minutes after)
First 2 minutes after market open
Wide spreads
Consecutive losing trades (take a break after 2 losses)
Quick Reference Checklist
Before Taking ANY Trade:
☑ SCALP shows LONG or SHORT (not WAIT)
☑ Score is 4 or higher
☑ Vol or Tape shows activity
☑ No conflicting diamond signals
☑ Stop loss level identified
☑ Target profit level identified
☑ Not in restricted time periods
After Entering:
☑ Set stop loss immediately
☑ Set profit targets
☑ Watch SCALP column - exit if changes to WAIT
☑ Watch for opposite-colored diamonds
☑ Move stop to breakeven after first target
☑ Exit all by market close
Advanced Tips
Scalping Psychology
Be patient: Wait for Score 5+ setups
Be decisive: When signal appears, act immediately
Be disciplined: Follow your stop loss always
Be flexible: Exit quickly if dashboard reverses
Optimization
Backtest on your specific instrument
Adjust RSI/Stoch levels for your market
Fine-tune volume thresholds
Keep a trade journal to track which setups work best
Multi-Timeframe Confirmation
Use 5-min dashboard as "trend filter"
Take 1-min trades only in direction of 5-min SCALP signal
Increases win rate by ~10-15%
Troubleshooting
Q: Dashboard shows WAIT most of the time
Normal - scalping is about patience. Quality > Quantity
3-8 good setups per day is excellent
Q: Too many false signals
Increase minimum Score requirement to 5 or 6
Only trade with volume surge (yellow backgrounds)
Add large order detection confirmation
Q: Signals too slow
You may be on too high a timeframe
Try 1-minute chart for faster signals
Ensure real-time data feed is active
Q: Support/Resistance not updating
Normal - updates every 3 bars
If completely stuck, remove and re-add indicator
Summary
This scalping system works best when:
✅ Multiple indicators align (Score 5+)
✅ Volume and tape speed confirm the move
✅ Order flow (diamonds) confirms direction
✅ Price is at key levels (support/resistance)
✅ You manage risk strictly
✅ You exit before market close
The golden rule: When SCALP says WAIT, you WAIT. Discipline beats frequency.

Volumatic VIDYA – Pro+1. Professional & Clear (recommended for TradingView)
Volumatic VIDYA Pro+ combines a dynamic VIDYA trend filter, Delta Volume pressure, and automatic pattern recognition (Double/Triple Tops & Bottoms, Head & Shoulders).
A complete technical tool for detecting momentum shifts, trend reversals, and trade entries across multiple timeframes.
2. Short & Catchy
Adaptive VIDYA trendline + Delta Volume + Pattern detection in one tool.
Instantly visualize market bias, structure, and momentum strength.
3. Educational / Analytical
Analyze market dynamics with VIDYA-based trend filtering, volume delta analysis, and automated pattern recognition.
Ideal for traders who combine price action with quantitative confirmation.

CVD Pro – Smart Overlay + Signals (with Persist Mode)What this Indicator Does
CVD Pro visualizes Cumulative Volume Delta (CVD) data directly on your main price chart — helping you detect real buying vs. selling pressure in real time.
Unlike most CVD scripts that run in a separate subwindow, this one overlays price-mapped CVD curves on the candles themselves for better confluence with market structure and FVG zones.
The script dynamically scales normalized CVD values to the price range and uses adaptive smoothing and deviation bands to highlight shifts in trader behavior.
It also includes automatic bullish/bearish crossover signals, displayed as on-chart labels.
⚙️ Main Features
✅ Price-mapped CVD Overlay
CVD is normalized (Z-score) and projected onto the price chart for easy visual correlation with price structure.
✅ Multi-Timeframe Presets
Three sensitivity presets optimized for different chart environments:
Strict (4H) → Best for macro trends and high-timeframe structure.
Balanced (1H / 30m) → Great for active swing setups.
Sensitive (15m) → Captures short-term intraday reversals.
✅ Dynamic Bands & Smoothing
Deviation bands visualize statistical extremes in delta pressure — helping to identify exhaustion and divergence points.
✅ Smart Buy/Sell Signal Logic
Automatic label triggers when the CVD Overlay crosses its smoothed baseline:
🟢 BULL LONG → Rising CVD above the mean (buyers in control).
🔴 BEAR SHORT → Falling CVD below the mean (sellers in control).
✅ Persist Mode
Toggle to keep the last signal visible until a new one forms — ideal for traders who prefer clean chart annotations without noise.
✅ Clean, Minimal Overlay
Everything happens directly on your chart — no extra windows, no clutter. Designed for use with Smart Money Concepts, Fair Value Gaps (FVGs), or volume imbalance setups.
🧩 Use Case
CVD Pro is designed for traders who:
Use Smart Money Concepts (SMC) or ICT-style trading
Watch for FVG reactions, breaker blocks, and liquidity sweeps
Need to confirm order flow direction or momentum strength
Trade intraday or swing setups with precision entries and clear bias confirmation
⚡ Recommended Settings
4H / 1H: Use Strict mode for major structure and confirmation.
1H / 30m: Balanced mode for clear mid-term trend alignment.
15m: Sensitive mode to catch scalps and lower-TF shifts.
🧠 Pro Tips
Combine with RSI or Market Structure Breaks (MSS) for additional confluence.
A strong CVD divergence near a key FVG or 0.5–0.705 Fibonacci zone often signals reversal.
Persistent CVD crossover + price structure break = high-probability entry.
🧩 Credits
Created by Patrick S. ("Nova Labs")
Concept inspired by professional order-flow analytics and adaptive Z-Score normalization.
Would you like me to write a shorter “public summary” paragraph (for the short description at the top of TradingView, the one-liner users see before expanding)?
It’s usually a 2–3 sentence hook like:
“Overlay-based CVD indicator that merges volume delta with price structure. Detect true buying/selling pressure using adaptive normalization, deviation bands, and clean bullish/bearish crossover signals.”

Volume ClusteringThis Volume Clustering script is a powerful tool for analyzing intraday trading dynamics by combining two key metrics: volume Z-Score and Cumulative Volume Delta (CVD). By categorizing market activity into distinct clusters, it helps you identify high-conviction trading opportunities and understand underlying market pressure.
How It Works
The script operates on a simple, yet effective, premise: it classifies each trading bar based on its statistical significance (volume Z-Score) and buying/selling pressure (CVD).
Volume Z-Score
The volume Z-Score measures how far the current bar's volume is from its average, helping to identify periods of unusually high or low volume. This metric is a powerful way to spot when institutional or large players might be entering the market. A high Z-Score suggests a significant event is taking place, regardless of direction.
Cumulative Volume Delta (CVD)
CVD tracks the net buying and selling pressure across different timeframes. The script uses a lower timeframe (e.g., 1-minute) and anchors it to a higher timeframe (e.g., 1-day) to capture intraday pressure. A positive CVD indicates more buying pressure, while a negative CVD suggests more selling pressure.
Cluster Categories
The script analyzes the confluence of these two metrics to assign a cluster to each bar, providing actionable insights. The clusters are color-coded and labeled to make them easy to interpret:
🟢 High Conviction Bullish: Unusually high volume (high Z-Score) combined with significant buying pressure (high CVD). This cluster suggests strong bullish momentum.
🔴 High Conviction Bearish: Unusually high volume (high Z-Score) coupled with significant selling pressure (low CVD). This cluster suggests strong bearish momentum.
🟡 Low Conviction/Noise: Low to moderate volume and mixed buying/selling pressure. This represents periods of indecision or consolidation, where market noise is more prevalent.
🟣 Other Clusters: The script also identifies other combinations, such as high volume with moderate CVD, or low volume with high CVD, which can provide additional context for understanding market dynamics.
Key Features & Customization
The script offers several customizable settings to tailor the analysis to your specific trading style:
Z-Score Lookback Length: Adjust the lookback period for calculating the average volume. A shorter period focuses on recent volume trends, while a longer period provides a broader context.
CVD Anchor & Lower Timeframe: Define the timeframes used for CVD calculation. You can anchor the analysis to a daily or weekly timeframe while using a lower timeframe (e.g., 1-minute) to capture granular intraday pressure.
High/Low Volume Mode: Toggle between "High Volume" mode (which uses 90th and 10th percentiles for clustering) and "Low Volume" mode (which uses 75th and 25th percentiles). This allows you to choose whether to focus on extreme events or more subtle shifts in market sentiment.

Volume Spikes + Daily VWAP SD BandsVolume Spikes + Daily VWAP SD Bands
This indicator combines volume spike detection to help traders identify potential absorption zones with daily VWAP and standard deviation bands , key price levels, continuation opportunities, and possible institutional bias.
Features:
Volume Spike Detection
Highlights candles with unusually high volume relative to a configurable SMA.
Optional filters:
Local highs/lows only (Only Use Valid Highs & Lows)
Candle shapes: Hammer / Shooter only
Candle color match: bullish spikes on green, bearish on red
Plots small circles above/below bars for bullish and bearish volume spikes.
Alerts available for both bullish and bearish spikes.
Interpretation: Volume spikes at local highs/lows can indicate absorption, where one side absorbs aggressive buying/selling pressure.
Daily VWAP
Calculates volume-weighted average price (VWAP) for the current day.
Optionally shows previous day’s VWAP for reference.
Plot lines are customizable with optional circles on lines for visual clarity.
Labels on the last bar show exact VWAP values.
Institutional Bias Insight: Price above both current and previous VWAPs may indicate bullish positioning; price below both VWAPs may indicate bearish positioning. Many professional traders consider this a clue to institutional bias, but it’s not guaranteed. Always confirm with volume, delta, or orderflow analysis.
Standard Deviation Bands
Optional x1 and x2 SD bands around the daily VWAP.
Visual fill between bands shows price volatility zones.
Can be used to identify potential support/resistance or absorption zones.
Use Case: Price bounces off first SD band may indicate continuation signals, especially when volume spikes occur at those levels.
Customizable Visuals
Colors for bullish and bearish volume spikes
VWAP and SD band colors and thickness
Optional circles and filled bands for better readability
Alerts
Bullish / Bearish Volume Spikes
Supports TradingView alert system for automated notifications
Advanced Use Cases:
Combine with Cumulative Delta or Orderflow tools to confirm true absorption zones.
Identify high-volume rejection candles signaling possible trend continuation.
Use VWAP positioning relative to price to assess potential institutional bias, keeping in mind it is probabilistic, not guaranteed.
Visualize intraday VWAP levels and volatility with SD bands for better trade timing.
Settings: Fully customizable, including volume multiplier, SMA length, session filter, candle shape, color options, and VWAP/SD display preferences.

BK AK-SILENCER🚨 Introducing BK AK-SILENCER — Volume Footprint Warfare, Right on the Price Bars 🚨
This isn’t a traditional indicator.
This is a tactical weapon — engineered to expose institutional behavior directly in the bar data, using volume logic, CVD divergence, and spike detection to pinpoint who’s really in control of the tape.
No panels. No clutter.
Just silent execution — built directly into price itself.
🔥 Why "SILENCER"?
Because real power moves in silence.
Institutions don’t chase — they build positions quietly, in size, beneath the surface.
BK AK-SILENCER gives you a real-time edge by visually revealing their footprints through color-coded bar behavior, divergence signals, and volume spike alerts — all directly on your chart.
🔹 “AK” honors my mentor A.K., whose training forged my trading discipline.
🔹 “SILENCER” represents the institutional mindset — high impact, low visibility. This tool lets you trade like them: without noise, without hesitation, with deadly clarity.
🧠 What Is BK AK-SILENCER?
A bar-level institutional detection tool, purpose-built to:
✅ Color-code bars based on volume aggression and close-location inside range
✅ Detect real-time bullish and bearish divergences between price and volume delta
✅ Tag volume spikes with a $ symbol to expose potential traps or silent position builds
✅ Overlay VWAP for real-time mean-reversion biasing
No extra windows.
No indicators talking over each other.
Just pure volume-logic weaponry embedded into price.
⚙️ What This Weapon Deploys
🔸 Bar Coloring Logic (Volume Footprint)
🟢 Power Buy = Strong close near highs on elevated volume
🟩 Accumulation = Weak close but still heavy volume
🔴 Power Sell = Strong close near lows on heavy selling
🟥 Distribution / Weakness = Low close without commitment
❗ Extreme Volume Spikes marked with $ — using standard deviation to highlight institutional bursts
🔸 CVD Divergence Detection
→ Tracks cumulative volume delta and compares it to price pivot behavior
Bullish Divergence = Price makes lower lows, CVD makes higher lows → hidden accumulation
Bearish Divergence = Price makes higher highs, CVD makes lower highs → hidden distribution
All plotted directly on bars with triangle markers.
🔸 VWAP Overlay (Optional)
→ Anchored VWAP gives immediate context for intraday bias — above VWAP = demand, below = supply
🎯 How to Use BK AK-SILENCER
🔹 Silent Reversal Detection
Bullish divergence + Power Buy bar + VWAP reclaim = sniper entry
Bearish divergence + Power Sell bar + VWAP rejection = trap confirmation
🔹 Volume-Based Entry Triggers
Look for Power Buy + $ spike after a pullback → watch for quiet reversal
Accumulation colors clustering? Institutions are likely loading silently
🔹 Institutional Trap Warnings
$ spike + red distribution bar at highs = time to exit or flip
Weakness bar below VWAP? Don’t chase the long.
🛡️ Why It Matters
✅ Clean — it integrates into price action, no separate panels
✅ Silent — tracks institutions who build without alerts or indicators
✅ Tactical — no fluff, no lag, just real-time behavior recognition
This tool is ideal for:
🔸 Scalpers reading bar-by-bar
🔸 Intraday swing traders using VWAP and structure
🔸 Professionals who need volume behavior decoded in real-time
🔸 Anyone who wants signal without clutter
🙏 Final Thoughts
This tool isn’t just about trading — it’s about tactical awareness.
🔹 Dedicated to my mentor A.K., whose wisdom runs deep in every logic tree.
🔹 Above all, I give thanks to Gd, the source of clarity, courage, and conviction.
Without Him, even the sharpest system is blind.
With Him, we execute with structure, purpose, and divine alignment.
⚡ No noise. No clutter. No delay. Just raw, silent execution.
🔥 BK AK-SILENCER — Bar-Level Volume Footprint Precision 🔥
Gd bless every step you take in this market.
Trade with clarity, move with intention. 🙏

CVD Divergence & Volume ProfileThis Pine Script indicator, named "CVD Divergence & Volume Profile," is designed to identify potential trading opportunities by combining Cumulative Volume Delta (CVD) divergence with Volume Profile levels and an optional Simple Moving Average (SMA) trend filter. It plots signals directly on the price chart.
Here's a breakdown of what each component does and how to potentially trade with it:
1. Cumulative Volume Delta (CVD) Divergence
What it does: CVD measures the cumulative difference between buying and selling volume. A rising CVD indicates more buying pressure, while a falling CVD indicates more selling pressure. Divergence occurs when the price action contradicts the CVD's direction, suggesting a potential shift in momentum or trend reversal.
Bearish Divergence: The price makes a higher high, but the CVD makes a lower high (or fails to make a new high). This suggests that despite the price increasing, the underlying buying pressure is weakening.
Bullish Divergence: The price makes a lower low, but the CVD makes a higher low (or fails to make a new low). This suggests that despite the price decreasing, the underlying selling pressure is weakening.
Visualization:
Red triangle pointing down on the chart indicates a Bearish Divergence signal.
Green triangle pointing up on the chart indicates a Bullish Divergence signal.
2. Volume Profile Levels (VAH, VAL, POC)
What it does: The indicator calculates simplified Volume Profile levels over a user-defined vp_range (number of candles). These levels represent areas where significant trading activity has occurred:
VAH (Value Area High): The upper boundary of the "Value Area," where 70% of the volume traded.
VAL (Value Area Low): The lower boundary of the "Value Area," where 70% of the volume traded.
POC (Point of Control): The price level within the vp_range where the most volume was traded.
Significance: These levels often act as significant support and resistance zones.
Visualization:
Orange lines for VAH and VAL.
Yellow line for POC.
Zone Proximity (zone_thresh): The indicator only generates divergence signals if the current close price is within a specified percentage zone_thresh of either VAH, VAL, or POC. This filters signals to areas of high liquidity and potential turning points.
3. Trend Filter (SMA)
What it does: This is an optional filter (use_trend_filter) that uses a Simple Moving Average (sma_period, default 200).
Significance: It helps ensure that divergence signals are traded in alignment with the broader market trend, potentially increasing their reliability.
For long signals (bullish divergence), the price (close) must be above the SMA (indicating an uptrend).
For short signals (bearish divergence), the price (close) must be below the SMA (indicating a downtrend).
Visualization: A blue line on the chart representing the SMA.
How to Trade with It (Potential Strategies)
The indicator aims to provide high-probability entry points by combining multiple confirming factors. Here's how you might interpret and trade the signals:
Identify Divergence: Look for the triangle signals on your chart (red for bearish, green for bullish).
Confirm Proximity to Volume Profile Levels: The signal itself confirms that the price is near a significant Volume Profile level (VAH, VAL, or POC). These are areas where price often reacts.
Bullish Signal (Green Triangle): This suggests buying momentum is returning after a price decline, especially when the price is near VAL or POC, which might act as support.
Bearish Signal (Red Triangle): This suggests selling momentum is increasing after a price rally, especially when the price is near VAH or POC, which might act as resistance.
Check Trend Alignment (SMA Filter):
For a long trade: You would ideally want to see a green triangle (bullish divergence) while the price is above the blue SMA line. This indicates a bullish divergence confirming a potential bounce within an existing uptrend.
For a short trade: You would ideally want to see a red triangle (bearish divergence) while the price is below the blue SMA line. This indicates a bearish divergence confirming a potential rejection within an existing downtrend.
Entry and Exit Considerations:
Entry: Consider entering a trade on the candle where the signal appears, or on the subsequent candle for confirmation.
Stop Loss: For a long trade, a logical stop-loss could be placed below the lowest point of the divergence, or below the VAL/POC if the signal occurred near it. For a short trade, above the highest point of the divergence or VAH/POC.
Take Profit: Targets could be set at the opposite Volume Profile level, previous swing highs/lows, or using a fixed risk-reward ratio.
Example Trading Scenario:
Long Trade: You see a green triangle (bullish divergence) printed on the chart. You notice the price is currently at the VAL (orange line). You check the blue SMA line and confirm that the price is above it (uptrend). This confluence of factors (bullish divergence, support at VAL, and uptrend) provides a strong potential long entry signal. You might enter, place your stop loss just below VAL, and target VAH or the next resistance level.
Short Trade: You see a red triangle (bearish divergence). The price is at the VAH (orange line). The price is also below the blue SMA line (downtrend). This suggests a potential short entry. You might enter, place your stop loss just above VAH, and target VAL or the next support level.

CVD Oscillator - Short Term SwiftEdgeOverview
The CVD Oscillator - Short Term is a technical indicator designed to assist traders in identifying short-term buying and selling pressure in the market. It calculates the Cumulative Volume Delta (CVD) to measure the net volume difference between buying and selling activity, displayed as an oscillator in a separate panel. This indicator is tailored for short-term trading strategies, such as scalping or day trading, on low timeframes (e.g., 1-minute, 5-minute, or 15-minute charts).
How It Works
Cumulative Volume Delta (CVD): The indicator calculates CVD by assigning volume to buyers (when close > open) or sellers (when close < open). If close = open, the volume is neutral.
Short-Term Focus: The CVD is calculated over a user-defined lookback period (default: 10 candles), making it sensitive to recent market activity.
Normalization: The raw CVD is normalized by dividing it by the average volume (over a short period, default: 5 candles) and scaled to fit within a range of -100 to +100, creating an oscillator-like behavior.
Reset Options: Users can reset the CVD at specific intervals (e.g., every minute, 5 minutes, 15 minutes, or daily) to focus on intraday movements.
Live CVD Value: The raw (unnormalized) CVD value is displayed as a label on each candle for real-time monitoring.
Key Features
Customizable Lookback Period: Adjust the number of recent candles (default: 10) to calculate CVD, allowing for precise short-term analysis.
Flexible Reset Periods: Choose to reset the CVD every 1 minute, 5 minutes, 15 minutes, daily, or never, to suit your trading style.
Normalized Oscillator: The CVD is scaled between -100 and +100, making it easier to visualize short-term momentum.
Live CVD Labels: Displays the raw CVD value on each candle, with options to position the label above or below the oscillator line.
How to Use
Add to Chart: Apply the indicator to your chart on a low timeframe (e.g., 1m, 5m, or 15m) for short-term trading.
Interpret the Oscillator:
Above 0 (Green): Indicates buying pressure dominates.
Below 0 (Red): Indicates selling pressure dominates.
Near 0: Suggests neutral market conditions.
Monitor Live CVD: Use the raw CVD value (shown in the label) to assess the exact net volume difference over the lookback period.
Combine with Other Tools: Use the oscillator alongside price action, support/resistance levels, or other indicators to confirm trading decisions.
Adjust Settings:
CVD Lookback Period: Set to a small value (e.g., 5-20 candles) for scalping.
CVD Reset Period: Choose "1m" or "5m" for intraday resets to focus on very short-term trends.
Volume Average Length: Use a short length (e.g., 3-5) for faster responsiveness.
Scale Factor: Increase (e.g., 2.0-3.0) to amplify small changes in CVD.
Settings
CVD Reset Period: Defines when to reset the CVD calculation ("None", "D" for daily, "15m", "5m", "1m").
CVD Lookback Period (Candles): Number of recent candles to calculate CVD (default: 10).
Volume Average Length: Period for averaging volume to normalize CVD (default: 5).
CVD Scale Factor: Adjusts the sensitivity of the normalized CVD (default: 2.0).
CVD Label Position: Choose to display the raw CVD label above or below the oscillator line.
CVD Label Color: Customize the color of the CVD label (default: white).
Limitations
Not a Standalone Tool: This indicator should be used in conjunction with other technical analysis tools, as it does not guarantee profitable trades.
Volume Dependency: The accuracy of CVD relies on the quality of volume data provided by your broker or exchange.
Short-Term Focus: The indicator is optimized for low timeframes and may produce noise on higher timeframes unless adjusted.
No Predictive Claims: The CVD Oscillator reflects past and current market activity but does not predict future price movements.
Notes
This indicator is designed for informational purposes and does not constitute financial advice. Trading involves risk, and past performance is not indicative of future results.
Test the indicator on a demo account to understand its behavior before using it in live trading.
Feedback is welcome! If you have suggestions for improvements, feel free to share them in the comments.

CVD OscillatorCVD Delta Oscillator
A momentum oscillator that measures buying and selling pressure through volume analysis, based on the principle that volume precedes price (cause and effect).
How It Works
Volume Analysis
Measures the force of buying and selling by analyzing how volume interacts with price movement within each bar
When price closes higher in a bar's range with strong volume, this indicates stronger buying pressure
When price closes lower in a bar's range with strong volume, this indicates stronger selling pressure
Momentum Measurement
Uses two EMAs (fast and slow) to smooth the volume delta
The difference between these EMAs creates an oscillator that shows:
Rising values = Buying pressure increasing
Falling values = Selling pressure increasing
Zero line crossovers = Potential shift in control between buyers and sellers
Signal Generation
Divergences
Bullish: Price falls to new lows while buying pressure increases (potential reversal up)
Bearish: Price rises to new highs while selling pressure increases (potential reversal down)
Zero-Line Crossovers
Bullish: Buying pressure overtakes selling pressure
Bearish: Selling pressure overtakes buying pressure
Practical Application
Reading the Indicator
Green columns above zero = Net buying pressure
Red columns below zero = Net selling pressure
Larger columns = Stronger pressure
Divergences and crossovers = Potential turning points
Trading Context
Helps identify when price movement has strong or weak volume support
Shows potential exhaustion points through divergences
Confirms trend changes through zero-line crossovers
Customization
Adjustable EMA periods for different trading styles
Toggle-able visual signals
Automatic alerts for all signals
